December non-farm payrolls data came in much hotter than expected. More jobs were added, the unemployment rate dipped slightly, and average hourly wages rose. Overall, it was a solid employment report, but the stock market didn’t like the news. Throw in the rise in inflation expectations to 3.3% in January as per the University of Michigan Survey of Consumers, and you get a scenario that points to fewer interest rate cuts from the Federal Reserve in 2025.
Investors don’t want to hear that.
Equity futures fell in pre-market trading, and the broader stock market indexes continued in that direction in the first half hour of regular trading hours. Since then, it has been a choppy day, with the broader indexes closing the day lower.
The Weakness Spreads
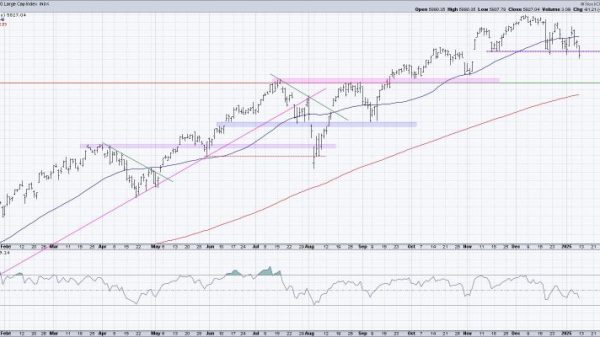
Inflation and fewer interest rate cuts sent investors into selloff mode. The S&P 500 ($SPX) closed at 5,827.04, down 1.54%, which brings the index below its November lows (dashed blue line in the chart below). The index closed a tad bit above the support of its 100-day simple moving average (SMA).
FIGURE 1. DAILY CHART OF THE S&P 500 INDEX. The index closed below its November lows and just a hair above its 100-day SMA. Market breadth is also weakening, as seen by the breadth indicators in the lower panels.Chart source: StockCharts.com. For educational purposes.
Market breadth indicators, such as the NYSE Advance-Decline Line, the percentage of S&P 500 stocks trading above their 200-day moving average, and the S&P 500 Bullish Percent Index, are trending lower. Also, notice the series of lower highs and slightly lower lows.
The Nasdaq Composite ($COMPQ) is trading below its 50-day SMA and has a series of lower highs and lower lows (see chart below).
FIGURE 2. DAILY CHART OF THE NASDAQ COMPOSITE. Lower highs and lower lows, a close below the 50-day SMA, and weakening breadth indicators indicate weakness in the tech-heavy index.Chart source: StockCharts.com. For educational purposes.
The Nasdaq Composite Bullish Percent Index ($BPCOMPQ), the percentage of Nasdaq stocks trading above their 200-day moving average, and the Nasdaq Advance-Decline Line are all declining, indicating weakening market breadth.
The S&P 600 Small Cap Index ($SML) was the worst performer, closing lower by over 2%. The chart below shows that the index closed at a key support level, the low of the September to November trading range. This makes it a greater than 10% decline from the November 25 high, which means the small-cap index is in correction territory.
FIGURE 3. DAILY CHART OF THE S&P 600 SMALL CAP INDEX. Small caps have suffered since December and are now at a key support level, which coincides with the low of a previous trading range.Chart source: StockCharts.com. For educational purposes.
Market breadth is weakening in the small-cap index, as indicated by the declining percentage of S&P 600 stocks trading above their 200-day MA and the decline in the Advance-Decline percentages.
Airlines Soar
It wasn’t bad for all industries. The Dow Jones US Airlines Index ($DJUSAR) was the top-performing StockCharts Technical Rank (SCTR) in the US Industries category. You can thank Delta Air Lines, Inc. (DAL) for that. The company reported better-than-expected Q4 earnings and gave a positive 2025 outlook. American Airlines (AAL), United Airlines (UAL), and Alaska Air Group (ALK) rose in sympathy to Delta’s earnings report.
FIGURE 4. AIRLINE INDUSTRY LEADS IN THE TOP 10 US INDUSTRIES SCTR REPORT. Strong earnings from Delta Air Lines helped lift airline stocks. The Dow Jones US Airlines Index was the top performer in the US Industries Top 10 SCTR Report.Image source: StockCharts.com. For educational purposes.
The Pressure of Rising Yields
Treasury yields moved sharply higher on the jobs report news, with the 10-Year Treasury yield reaching a high of 4.79% (see chart below). The last time yields were at this level was in October 2023.
FIGURE 5. DAILY CHART OF THE 10-YEAR US TREASURY YIELD. The 10-year yield rose sharply after the strong jobs data on Friday. Chart source: StockCharts.com. For educational purposes.
According to the CME FedWatch Tool, the probability of the Fed holding rates at the current 2.45%–2.50% in their January 29 meeting is 97.30%.
The US dollar continues to strengthen, an indication the US economy remains strong relative to other countries. Precious metals and bitcoin traded higher, which could be because geopolitical risks could soon be a focal point.
There were many significant moves this week—equities fell, yields rose, and the US dollar continued to strengthen. Volatility is stirring, although, at below 20, it still indicates investors are somewhat complacent. A spike in the Cboe Volatility Index ($VIX) and a breakdown of some of the support levels the broader indexes are hanging on to, could put the US stock market into correction territory. Let’s see if the PPI and CPI move the needle next week.
End-of-Week Wrap-Up
S&P 500 down 1.94% for the week, at 5827.04.47, Dow Jones Industrial Average down 1.86% for the week at 41,938.45; Nasdaq Composite down 2.34% for the week at 19,161.63
$VIX up 21.14% for the week, closing at 19.54
Best performing sector for the week: Energy
Worst performing sector for the week: Real Estate
Top 5 Large Cap SCTR stocks: Rocket Lab USA, Inc. (RKLB); Applovin Corp. (APP); Amer Sports, Inc. (AS); Credo Technology Group Holding Ltd. (CRDO); Reddit Inc. (RDDT)
On the Radar Next Week
December PPI
December CPI
December Retail Sales
December Housing Starts
Fed speeches from Barkin, Kashkari, Schmid, Goolsbee
Disclaimer: This blog is for educational purposes only and should not be construed as financial advice. The ideas and strategies should never be used without first assessing your own personal and financial situation, or without consulting a financial professional.

