Connect with us

Hi, what are you looking for?

Stock

How to Use the ADX Indicator (Trend Strength Explained)

In this exclusive StockCharts TV video, Joe presents an introduction to the Average Directional Index (ADX), sharing how it is calculated and how to use it. He highlights some of the strengths, and weaknesses, of this powerful indicator. He then analyzes Bitcoin, NVDA, and AVGO, and finishes up the show with a number of symbol requests from viewers.

This video was originally published on September 25, 2024. Click this link to watch on StockCharts TV.

Archived videos from Joe are available at this link. Send symbol requests to stocktalk@stockcharts.com; you can also submit a request in the comments section below the video on YouTube. Symbol Requests can be sent in throughout the week prior to the next show.

Click to comment

Leave a Reply

Your email address will not be published. Required fields are marked *

You May Also Like

Politics

As President Biden meets with Chinese President Xi Jinping on Wednesday, the House select committee examining the United States’ relationship with China is set...
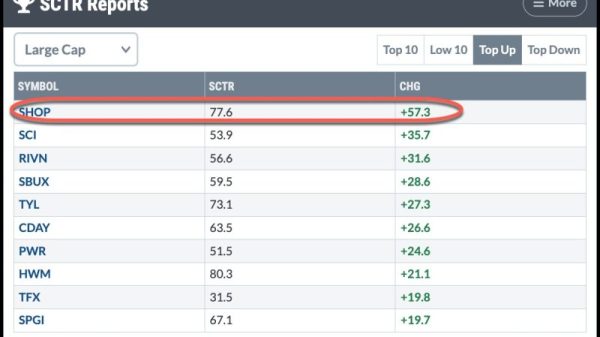
Stock

Shopify (SHOP) share value jumped by over 20% Thursday morning after stunning analysts with a sharp earnings beat and rosy guidance. The stock reached...

Politics

WILMINGTON, Del. — President Biden’s steadfast support for Israel is facing increasing pressure as some of his staunch supporters from within his party are...

Politics

In the weeks after the 2020 election, an obscure Republican lawmaker from Louisiana led a congressional effort to overturn the presidential results in four...